Datasets

   Download cosmic-ray dataset

   Download other datasets and files

Cosmic-ray dataset

The dataset consists of 10% of all the events recorded by the Pierre Auger Observatory that pass high-level quality selection checks (explained below). The periods of data recording are: from January 2004 to August 2018 for the SD1500 events; from December 2004 to December 2017 for the hybrid events (SD1500 & FD); from January 2014 to August 2018 for the SD750 events and for the hybrid events involving the HEAT-Coihueco telescopes. These Open Data have been subjected to the reconstruction procedures used by the Auger Collaboration in their official software [Nucl. Instr. Meth. A 580 (2007) 1485–1496 (arXiv)] and explained in [ JCAP 08(2014) 019 (arXiv)], [ JINST 15 (2020) P10021 (arXiv)] and [ Eur. Phys. J. C 81, 966 (2021) (arXiv)].

Pseudo-raw data for the observed cosmic rays are released in JSON format files, one for each event, named "Auger_yydddsssssxx.json", where "yydddsssssxx" is the "id" number which identifies the event. Files consist of different sections, whose number and type depend on the kind of event. Sections and variables are listed below.

In addition, summary files (CSV format) contain the high level information for each reconstructed event in the specific data sample. More details are also given in the semantics section. Note that events observed by multiple FD sites (Eyes) appear once per Eye in the summary file and this has to be taken into account to avoid double counting.

Download the JSON pseudo-raw data for all cosmic ray events (826 MB - individual event JSON data can also be downloaded individually from the event display page).

Download the CSV summary files (8 MB). This file includes all the reconstruction information and should be enough for most physics analyses.

All Auger Open Data have a DOI that you are requested to cite in any applications or publications. The DOI of the main dataset is 10.5281/zenodo.4487612, which always points to the current version. The Auger Collaboration does not endorse any work, scientific or otherwise, produced using these data, even if available on, or linked from, this portal.

How were the cosmic-ray Open Data selected?

The Open Data includes 10% of the data set used in the Auger physics analyses presented at the International Cosmic Ray Conference in 2019. They correspond to the events for which the identification number ("sdid") ends with a zero.

The Open Data recorded with the water-Cherenkov detector arrays are the result of a set of selection criteria applied to detected events. The first requires that the WCD with the highest signal, or closest to the core, is surrounded by a hexagon of six stations that are operational. This requirement ensures adequate sampling of the shower and allows for the evaluation of the aperture of the surface detector in a purely geometrical manner in the energy regime where the array is fully efficient [Nucl.Instrum.Meth.A 613 (2010) 29-39 (arXiv), JCAP 08(2014) 019 (arXiv)], [ Eur. Phys. J. C 81, 966 (2021) (arXiv)]. The detection-efficiency of the SD1500 array is greater than 97% for events with energy above 2.5 x 10¹⁸eV arriving from a zenith angle (θ) less than 60°, and 4 x 10¹⁸ eV for showers arriving between 60° and 80°. For the SD750 array, the detection efficiency becomes greater than 98% at around 1017eV.

The Open Data of the surface detector arrays have also been subjected to criteria that guarantee good performance of operation: for example, time intervals during which the data acquisition was unstable are excluded; photomultipliers with unstable baseline, loss of calibration data, unstable ratio between high- and low-gain channels, etc., are also excluded.

The Open Data for the hybrid events are selected by requiring the fulfillment of several criteria, including hardware status (at the level of the telescope and pixels) and requiring the quality of the reconstruction of shower geometry and profile (including uncertainties associated with the energy and depth of maximum). Additionally, the atmospheric characterization (including information on the presence of aerosols and clouds, and the vertical optical transparency) is taken into account. Specific fiducial volume cuts are applied for different analyses in order to achieve uniform acceptance and minimize the uncertainties on the corresponding observables. Events passing the selection for the energy spectrum, the calibration, and/or the depth of maximum analyses, are flagged accordingly ("hdSpectrum","hdCalib","hdXmax").

How were the cosmic-ray Open Data reconstructed?

To illustrate the reconstruction procedures used for events recorded with WCD arrays and with the air-fluorescence telescopes (and the related variables) two exemplary events are used. One (event 81847956000) triggered simultaneously the SD1500 array and two FD sites, the other (event 141476578900) triggered the SD750 array and the HEAT-Coihueco telescopes. The figures are extracted from the event-display, where these events are available: event 81847956000, event 141476578900.


Footprint of an extensive air shower hitting WCD stations in the SD750 array (see text)


Footprint of an extensive air shower hitting WCD stations in the SD1500 array (see text)

In the adjacent figures the ground view of each event is shown. The colored squares indicate the FD sites that observed the shower. The colored dots correspond to SD1500 (SD750) stations which were hit by the shower particles and that have been selected for the reconstruction process ("recstations"). The areas of the dots are proportional to the logarithm of the magnitude of the signal sizes, while the colors represent the time of arrival ("t") at the different stations (green: early stations; red: late stations). The grey dots indicate detectors which have recorded no signal, while the black dots represent those which, even if a signal was recorded, were not part of the shower event ("isSelected=0"), but due to an unassociated cosmic ray (usually a muon). The position of the core ("x", "y", "z"), where the highest signal would be observed, is marked by the head of the blue arrow, which indicates the azimuth angle ("phi") of the shower direction of arrival.

The signal timing and signal sizes measured in each selected station, as well as the positions of the stations (the stations coordinates can be found in sdMap.csv), are the inputs for the reconstruction of the events [JINST 15 (2020) P10021 (arXiv)].

The signal features are computed from the output of the flash analogue-to-digital converters (FADCs) associated with each photomultiplier (PMT). Examples of such signals in two stations in the event are displayed in the figure below.


FADC traces of the PMTs signals in two different WCD stations hit by the shower

The FADC trace, shown for each of the 3 PMTs with different colors, are for a station 565 m away from the core (top figure) and one 2602 m away (bottom figure). They are expressed in terms of VEMs (Vertical Equivalent Muons) where one VEM is the signal due to a single muon traversing a detector. The FADCs are digitised so as to give a measurement every 25 ns. The traces from the closer detector are relatively smooth and are compressed into ~1000 ns while at the greater distance the signal arrives over a period of ~4000 ns. Most of the large spikes seen in the more distant FADC signals are probably due to muons which cross the detector, though high-energy electrons that would penetrate the full depth of the water may be present close to the shower axis and are expected to arrive early in the time window. More typically, however, the mean energy of an electron or photon in a shower at several 100 metres from the shower axis is ~10 MeV in contrast to typical muon energies of > 500 MeV. The energy loss of a relativistic particle that traverses a tank in a vertical direction is ~250 MeV.

The signal timing, in terms of start- and stop-times (located at "signalStartBin", "signalStopBin" in the trace, respectively), is determined from a separate analysis of the structures of the FADC traces, after the subtraction of the baselines, in the high-gain channel of each working PMTs in a station. By merging the extracted information from the PMTs, the start-time ("t") that is determined represents the best estimate of the beginning of the passing shower front. The procedure applied to determine the stop-time ensures that all particles belonging to the shower are included while excluding as many accidental signals as possible. The signal size ("signal") is obtained by integrating the final trace (converted in VEMs), which consists of the bin-by-bin average of the traces of the PMTs in the high-gain channel ("sat=0"), or low-gain channel if the high-gain is saturated ("sat=1", "sat=2"), between the determined start and stop times.

To initiate the reconstruction of the zenith and azimuth angles of the shower arrival direction ("theta", "phi"), an estimation of the location of the core on the ground is obtained as the signal-weighted center-of-mass of the selected stations in an event. Then the start-times of the signals in each station are fitted to a model that describes the shower particles as moving with the speed of light in a curved shower front. Thus the two directional cosines and the time at which the core strikes the ground are determined. The radius of curvature ("R") is also set as a free parameter when five or more stations are selected for the event reconstruction. The arrival direction is determined to a precision of about 1°, a figure that falls as the energy (and hence the multiplicity of stations triggered) rises.


Fall-off of the signals size as a function of the distance to the shower core (blue dots) fitted with the lateral distribution function (yellow line)

The reconstruction of the arrival direction of the shower is followed by the calculation of the energy estimator and of the position of the impact point at the ground ("x", "y", "z"). For vertical events, a fit to a lateral distribution function (ldf) is performed. In the adjacent figure the fall-off of the signal sizes (blue dots) with distance ("spDistance"), in a plane perpendicular to the direction of the shower, is shown together with a yellow line that defines the ldf used to fit the event. The signal at an “optimal distance”, which depends predominantly on the spacing between detectors and can be found accurately independent of knowledge of the exact shape of the ldf, represents the shower size and acts as a surrogate for the energy of the primary particle which has initiated the shower. For a spacing of 1500 m the optimal distance is 1000 m, thus the reference signal is S(1000), ("s1000"), while for a spacing of 750 m the optimal distance is 450 m and the reference signal is is S(450), ("s450"). The uncertainty in the measurement of S(1000) decreases from 15% at a shower size of 10 VEM (roughly corresponding to E ~ 2.5 x 10¹⁸ eV) to 5% at the highest shower sizes. The uncertainty on the impact point is of order 50 m. The reference signal is influenced by changes in atmospheric conditions that affect shower development [JINST 12 (2017) P02006 (arXiv)] and by the geomagnetic field that impacts on the shower particle-density [JCAP11 (2011) 022 (arXiv)]. Corrections of order 2% and 1% for the atmospheric and geomagnetic effects ("wcorr", "gcorr"), respectively, are made to the reference signal.


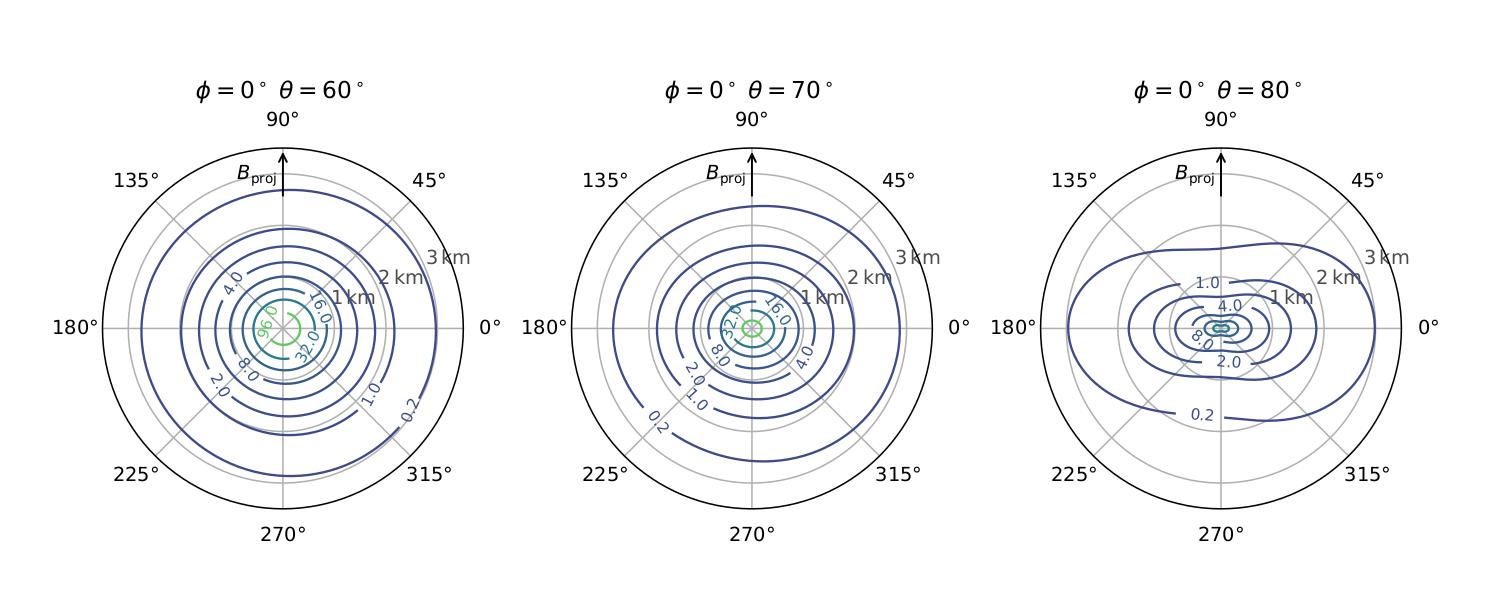
Parameterized densities of muons for a 10 EeV proton shower at zenith angles of 60°, 70° and 80°arriving from azimuth, φ = 0°. Radial units are in kilometers. The coordinate system is defined in the plane perpendicular to the shower direction with the y-axis parallel to the projection of the Earth’s magnetic field on that plane. The magnitude of the muon densities are indicated along the solid line.

For inclined events, the method used for reconstruction of the energy estimator and core position is modified. Due to their long path in the atmosphere, muons, the particles that contribute most of the signal for inclined showers, are deflected in the Earth’s magnetic field. As a result, the near-cylindrical symmetry of the showers is lost and the distribution of the signals at the ground is described with a 2D ldf (so-called muon map). By scaling the muon map of a reference proton shower at 1019 eV an energy estimator, N19 ("n19"), is obtained. The uncertainty in N19 decreases from 13% at E ~ 4 x 10¹⁸ eV to 4% at the highest energy. The uncertainty on the impact point is of order 100 m [ JCAP 08(2014) 019 (arXiv)].

For a cosmic ray of a given energy, the shower size estimators depend on the zenith angle because, once it has passed the depth of shower maximum, a shower is attenuated as it traverses the atmosphere. The intensity of cosmic rays, defined as the number of events per steradian above some S(1000)/S(450)/ N19 threshold, is thus dependent on zenith angle. Given the highly isotropic flux, the intensity is expected to be independent from the zenith angle after correction for the attenuation. Based on this principle, an empirical procedure, the so-called Constant Intensity method, is used to determine the attenuation curve as a function of the zenith angle and therefore an energy estimator, independent of the zenith angle. This can be thought as being the signal at 1000 (450) meters, or N19, that a shower would have produced had it arrived at 38° (35°) or 68°, the median angles of the zenith distribution for the SD1500 (SD750) array in the respective angular ranges (vertical or inclined). The energy ("energy") associated with the SD event is derived from a calibration between the energy estimator S38 (S35) or N68, "s38" ("s35") or "n68", and the energy measured by the FD ("totalEnergy") in golden-hybrid events. The SD1500 energy resolution is about 20% at 2x10¹⁸ eV and about 7% above 2x10¹⁹ eV. The systematic uncertainty on the energy scale is 14% [Physical Review D 102, 062005 (2020) (arXiv)]. The SD750 energy resolution is about 22% at 1017 eV and about 12% above 1018 eV [ Eur. Phys. J. C 81, 966 (2021) (arXiv)].

Camera view for Los Leones
Camera view for Coihueco
Camera view for HEAT-Coihueco

In the adjacent figure the shower images observed with the Los Leones, Coihueco, and HEAT-Coihueco fluorescence telescopes are displayed. The colors show the time at which the light reaches each pixel ("pixelTime"). The trigger conditions require some pixels to be aligned, but background light can also be recorded (the variable "pixelStatus" will also tell up to which level they are used to reconstruct the shower).

Together with the telescope position, the direction that the pixels point to in the sky (shown in Elevation and Azimuth angles -- from fdPixelMap.csv) determine a plane containing the shower development in the atmosphere ("SDP") . The shower axis within this plane is obtained from the time of arrival of the light at the camera ("TimeFit"), summing the contributions of two distances traveled at the speed of light: the distance crossed by the shower front to a point where light is emitted and the distance this light crosses to the telescope. The time at which the shower front reaches the ground, given by the timing information from the WCD station with the highest signal ("hottestStationId"), sets a strong constraint on the hybrid geometrical reconstruction, (providing "theta", "phi", "x", "y", "z"). For this event, the hottest WCD station is found at ("distSdpStation") around 500 m from the shower detector plane defined with Los Leones and around 250 m for the plane defined with Coihueco (at slightly larger distances from the reconstructed shower axis, "distAxisStation").

The next figure shows the energy deposited ("energyDepositProf") in the atmosphere as a function of the slant depth crossed by the cosmic ray ("atmDepthProf"), as seen independently in the two FD sites. LL is shown in blue and CO in green: the density of points and the uncertainty changes with the position from which the shower is seen.

The integral of this curve gives a direct measurement of the calorimetric energy ("calEnergy") of the primary particle, while the depth at which the maximum of the energy deposition occurs ("xmax") is used to infer the primary particle properties. The reconstruction of each point in the profile from the light seen on the camera ("pixelCharge") depends on the distance to the telescope and on the height in the atmosphere at which the energy is deposited ("distXmax" and "heightXmax").

The detected fluorescence light is proportional to the energy deposition and is emitted isotropically. Cherenkov light is emitted in the forward direction and enters the telescope directly when the shower axis is viewed from the telescope at a small angle ("minViewAngle"). It can also be scattered and reach the telescope at later times, which usually accounts for a fraction of the total detected photons ("cherenkovFraction"). For this example, the minimum viewing angles are 18° and 52°, at LL and CO, respectively; with corresponding Cherenkov fractions of 17% and 7%. Both Fluorescence and Cherenkov light are used in the reconstruction [Nucl.Instrum.Meth.A 798 (2015) 172-213 (arXiv)]. The light is attenuated and scattered when crossing the atmosphere, so both the distance traveled and the atmospheric parameters must be taken into account when estimating the expected number of detected photons that correspond to the emission at each position in the shower development, which is proportional to the deposited energy. The energy deposited per unit depth (dE/dX) in the atmosphere increases, at first, with the multiplication of particles in the shower, and then decreases as the energy loss by ionisation starts to exceed that by Bremsstrahlung. This behavior gives rise to a reasonably universal profile shape, where the position of the maximum Xmax depends on the primary particle type (and its energy). The shape of the profile is described by xmax and the corresponding dEdXmax and two other variables (upsL and uspR) [JCAP 03 (2019) 018 (arXiv)]. The integration of the profile provides a direct calorimetric measurement of the total energy of the primary cosmic ray (calEnergy), pending the correction from the energy taken away by muons (that can be partially detected in the SD) and neutrinos (which will go undetected) [Phys. Rev. D 100, 082003 (2019) (arXiv)] to finally obtain the totalEnergy.

File index and contents

Data are released in JSON format files, one for each event, named "Auger_yydddsssssxx.json", where "yydddsssssxx" is the "id" number which identify the event. Files consist of different sections, whose number and contents depend on the kind of event.

The datasets consist of an archive of JSON files (one per event). Events (files) in which the JSON data have a section "sdrec" have been reconstructed using data from the SD arrays. Events in which the section "fdrec" is present have been reconstructed using data from the FD telescopes (brass-hybrid events). Events in which both the "sdrec" and "fdrec" sections are present have been independently reconstructed using data from the surface and fluorescence detectors (golden-hybrid events). Events which have been observed by more than one FD site are called multi-eye hybrid events.

Event type Number of events
1500 m array 750 m array
SD reconstructed 25086 54481
brass hybrids 3156
golden hybrids 1602 197
multi-eye hybrids 34

Section "meta" is included in all files and contains general details about the release and softwares used for data reconstruction.

"meta": {"type", "release", "format", "reconstruction": {"software", "version"}}

Sections "info" and "flags" are present in all events and give generic information about the event and which reconstruction quality flags are passed.

"info": {"id", "sdid", "gpstime", "date"},
"flags": {"sd1500", "sd750", "hdSpectrum", "hdCalib", "hdXmax", "multiEye"}

Section "fdrec" is provided only for hybrid events and is a collection of reconstruction parameters for each telescope that saw the event.

"fdrec": [
{"id", "gpsnanotime", "hdSpectrumEye", "hdCalibEye", "hdXmaxEye", "theta", "dtheta", "phi", "dphi", "l", "b":, "ra", "dec", "totalEnergy", "dtotalEnergy", "calEnergy", "dcalEnergy", "xmax", "dxmax", "heightXmax", "distXmax", "dEdXmax", "ddEdXmax", "x":, "dx", "y", "dy", "z", "easting", "northing", "altitude", "cherenkovFraction", "minViewAngle", "uspL", "duspL", "uspR", "duspR", "hottestStationId", "distSdpStation", "distAxisStation"},
{...},

]

Section "eyes" is a collection of the FD sites which detected the event.

"eyes": [
{"id", "name", "atmDepthProf", "energyDepositProf", "denergyDepositProf", "pixelID", "pixelTime", "pixelCharge", "pixelStatus"},
{...},

]

The "sdrec" section is provided only for reconstructed SD events, and varies according to the characteristics of the event (sd1500/sd750, vertical/inclined)

SD1500 vertical
"sdrec": { "gpsnanotime", "theta", "dtheta", "phi", "dphi", "energy", "denergy", "l", "b", "ra", "dec", "x", "dx", "y", "dy", "z", "easting", "northing", "altitude", "R", "dR", "s1000", "ds1000", "s38", "gcorr", "wcorr", "beta", "gamma", "chi2", "ndf", "geochi2", "geondf", "nbstat", "recstations"}

SD1500 inclined
"sdrec": { "gpsnanotime", "theta", "dtheta", "phi", "dphi", "energy", "denergy", "l", "b", "ra", "dec", "x", "dx", "y", "dy", "z", "easting", "northing", "altitude", "n19", "dn19", "n68", "dn48", "geochi2", "geondf", "nbstat", "recstations"}

SD750
"sdrec": { "gpsnanotime", "theta", "phi", "energy", "l", "b", "ra", "dec", "x", "dx", "y", "dy", "z", "easting", "northing", "altitude", "s450", "ds450", "s35", "beta", "gamma", "chi2", "ndf", "geochi2", "nbstat", "recstations"}

Section "stations" is provided for all events. "stations" is an array with size equal to the number of triggered stations.

"stations": [
{"id", "name", "x", "y", "z", "t", "dt", "signalStartBin", "signalStopBin", "signal", "dsignal", "sat", "isSelected", "spDistance", "dspDistance", "pmt1", "pmt2", "pmt3"},
{...},

]

A summary file (CSV format) contains information for each reconstructed event.

Events in this file are listed according to their 'id', one for each line. In case of multi-eye hybrids, the event is duplicated in additional rows, one for each "eye".

Each line consists of comma separated numeric-fields, a subsample of the variables contained in the json files: variables of the sections 'sdrec' are characterized by the prefix 'sd_', variables of the sections 'fdrec' and 'Eyes' are are characterized by the prefix 'fd_'.

The number of fields in each line is the same for all types of events. However if a section is not present in the json file the corresponding fields are empty.

The summary files also contain the value of the integrated exposure ("sd_exposure") for the reconstructed events. For the SD1500 array the energy-threshold for full-efficiency is 2.5×10¹⁸ eV (4×10¹⁸ eV) for vertical (inclined) events. For the SD750 array the energy-threshold for full-efficiency is 1017 eV.

Semantics

Section Subsection Variable Description
meta typename of the release
releaseversion of the release: it defines the event sample
formatversion of data format
reconstructionsoftware, versionsoftware-framework used for the event reconstruction and its version
info idevent identification number: YYDDDSSSSSXX
- YY : last 2 digits of year
- DDD : day number between 1 and 366
- SSSSS: second of the current DAY between 0 and 86399
- XX : order of the event at the current second
Time is expressed in UTC+12h., i.e., the day starting at noon
sdidevent number from data acquisition
gpstimeGPS time
datedate and time in ISO 8601 format
flags sd1500
[0,1]
1: event is used in 1500 m array analysis
sd750
[0,1]
1: event is used in 750 m array analysis
hdSpectrum
[0,1]
1: event used for hybrid energy spectrum analysis
hdCalib
[0,1]
1: event used for hybrid energy calibration analysis
hdXmax
[0,1]
1: event used for hybrid Xmax analysis
multiEye
[0,1]
1: a multi-eye event
fdrec id
[1,2,3,4,5,6]
Indicates the FD site
'1': Los Leones
'2': Los Morados
'3': Loma Amarilla
'4': Coihueco
'5': HEAT
'6': HEAT-Coihueco
gpsnanotime [ns]The GPS time of the event within its GPS second
hdSpectrumEye
[0,1]
1: Eye used for the spectrum analysis
hdCalibEye
[0,1]
1: Eye used for energy calibration analysis
hdXmaxEye
[0,1]
1: Eye used for Xmax analysis
theta, phi
[deg]
The zenith and azimuth angles
dtheta, dphi
[deg]
Uncertainties in zenith and azimuth angles
l, b
[deg]
Galactic longitude and latitude of the event
ra, dec
[deg]
Right ascension and declination of the event
totalEnergy
[EeV]
Total energy of the primary particle initiating the event
dtotalEnergy
[EeV]
Uncertainty in the total energy of the event
calEnergy
[EeV]
Calorimetric energy of the event
dcalEnergy
[EeV]
Uncertainty in the calorimetric energy of the event
xmax
[g/cm2]
Position of the maximum of the energy deposition in the atmosphere
dxmax
[g/cm2]
Uncertainty in the position of the maximum of the shower development in the atmosphere
heightXmax
[m a.s.l.]
Height of Xmax above the ground
distXmax
[m]
Distance of Xmax to FD eye
dEdXmax
[PeV/(g/cm2)]
Maximum energy deposit
ddEdXmax
[PeV/(g/cm2)]
Uncertainty in the maximum energy deposit
x, y, z
[m]
Coordinates of the shower core projected at ground level (site coordinates system)
dx, dy, dz
[m]
Uncertainty in the coordinates of the shower core projected at ground level (site coordinates system)
easting, northing
[m]
Eastward and Northward coordinate of the shower core projected at ground level (UTM coordinates system)
altitude
[m]
Altitude of the shower core projected at ground level (UTM coordinates system)
cherenkovFractionFraction of detected light from Cherenkov emission
minViewAngle
[deg]
Light emission angle from the shower towards the FD eye
uspL
[g/cm2]
Universal shower profile shape parameter L
uspRUniversal shower profile shape parameter R
duspL
[g/cm2]
Uncertainty in the Universal Shower Profile parameter L
duspRUncertainty in the Universal Shower Profile parameter R
hottestStationIdid of the SD station with the highest recorded signal
distSdpStation
[m]
Distance of the hottest station to the plane that includes the shower axis and the eye position (SDP)
distAxisStation
[m]
Distance of hottest station to the reconstructed shower axis in the shower plane
eyes id
[1-6]
Id of the FD site:
1: Los Leones
2: Los Morados
3: Loma Amarilla
4: Coihueco
'5': HEAT
'6': HEAT-Coihueco
nameName of the FD site
atmDepthProf
[g/cm2]
Array of slant depth points measured. The array dimension depends on the number of triggered pixels
energyDepositProf
[PeV/(g/cm2)]
Array of energy deposit at each slant depth, obtained from the shower profile fit. The array dimension depends on the number of triggered pixels
denergyDepositProf
[PeV/(g/cm2)]
Array of the uncertainty in the energy deposit at each slant depth, obtained from the shower profile fit. The array dimension depends on the number of triggered pixels
pixelID
[1-3960]
Array of the pixel ids. The array dimension depends on the number of triggered pixels. The camera of each telescope consists of 440 pixels. Each eye is composed of 440 x 6 pixels, except for the HEAT-CO eye, composed by 440 x 9 pixels.
pixelTime
[100 ns]
Array of the times of the signal centroid in each pixel. The array dimension depends on the number of triggered pixels
pixelCharge
[number of photons at telescope aperture]
Array of the light detected in each pixel (proportional to the charge). The array dimension depends on the number of triggered pixels
pixelStatus
[0-4]
Array that indicates the status of the pixel
0=Background
1=Triggered
2=Pulse
3=SDP (shower detector plane)
4=TimeFit
sdrec gpsnanotime
[ns]
GPS time
theta
[deg]
Zenith angle
dtheta
[deg]
Uncertainty in the zenith angle
phi
[deg]
Azimuth angle
dphi
[deg]
Uncertainty in the azimuth angle
energy
[EeV]
Energy
denergy
[EeV]
Uncertainty in the energy
l,b
[deg]
Galactic longitude and latitude
ra,dec
[deg]
Right ascension and declination
x,y,z
[m]
Coordinate of the shower core (site coordinates system)
dx,dy
[m]
Uncertainty in the coordinates of the shower core (site coordinates system)
easting,northing,altitude
[m]
Eastward-,northward-coordinate and altitude of the shower core (UTM coordinates system)
R
[m]
Radius of curvature of the shower
dR
[m]
Uncertainty in the radius of curvature of the shower
s1000
[VEM]
Expected signal at 1000 m from the core, S(1000), used as estimator of the energy of detected with the 1500 m array
ds1000
[VEM]
Uncertainty in S(1000)
s450
[VEM]
Expected signal at 450 m from the core, S(450), used as estimator of the energy of shower detected with the 750 m array
ds450
[VEM]
Uncertainty in S(450)
s38
[VEM]
Signal produced at 1000 m by a shower with a zenith angle of 38 deg in the 1500 m array
s35
[VEM]
Signal produced at 450 m by a shower with a zenith angle of 35 deg in the 750 m array
n19 Energy estimator, N19, of a shower with a zenith angle > 60 deg
dn19Uncertainty in N19
n68N19, that a shower would have produced had it arrived at 68 deg
dn68Uncertainty in N68
gcorr
[%]
Geomagnetic correction to S(1000)
wcorr
[%]
Weather correction to S(1000)
beta,gammaSlope parameters of the fitted LDF
chi2Chi-square value of the LDF fit
ndfNumber of degrees of freedom in the LDF fit
geochi2Chi-square value of the geometric fit
geondfNumber of degrees of freedom in the geometric fit
nbstatNumber of triggered stations used in reconstruction
recstationsList of ids of the triggered stations used in reconstruction
stations idId
nameName
x,y,z
[m]
Coordinates
t
[ns]
Start time of the signal
dt
[ns]
Uncertainty in the start time
signalStartBin,signalStopBinFADC trace bins that indicate the start and stop of the signal
signal
[VEM]
Integrated signal in the FADC traces
dsignal
[VEM]
Uncertainty in the integrated signal
sat
[0-2]
0: high-gain and low-gain channels not saturated
1: high-gain channel saturated
2: high-gain and low-gain channels saturated
isSelected
[0-1]
1: the station is used in the reconstruction
spDistance
[m]
Distance of the station to the core in the plane perpendicular to the shower axis (shower plane)
dspDistance
[m]
Uncertainty in the distance of the station to the core in the plane perpendicular to the shower axis (shower plane)
pmt1,pmt2,pmt3
[VEM]
FADC traces from each photomultiplier. The length of each FADC trace is 768 bins. A bin corresponds to 25 ns

Scaler data

The Auger Scaler Open Data consist of more than 1015 events detected from March 2005 to December 2020. They have been recorded via the so-called "scaler mode", or "particle-counting" mode, which counts the particles hitting each of the 1600 water-Cherenkov detectors during a time interval of 1 second. The scaler mode was installed in all Auger surface detectors starting from March 2005, and then improved in September 2005.

For every station during every second, the scalers record the number of times that the amplitude of the signal is larger than 3 ADC counts, corresponding to an energy deposit of about 15 MeV, and smaller than 21 ADC counts, corresponding to an energy deposit of about 100 MeV. These energy depositions arise from the remnants of showers produced by primary cosmic-rays with energies from ~10 GeV to a few TeV. The upper threshold, that was implemented in September 2005, is intended to reject muons. The typical rate per detector is ~2 kHz (it was 3.8 kHz before September 2005). As most events counted by individual detectors are due to residual particles of showers generated by low-energy cosmic rays, and thus largely absorbed in atmosphere before reaching the surface array, the scaler mode does not allow one to reconstruct the shower parameters, i.e. the energy and the direction. However, it allows one to study the temporal behavior of the number of counts, which is modulated by terrestrial and extraterrestrial phenomena. As for the latter, these scaler data have been previously employed in studies of solar transient events like Forbush decreases and identification of modulations related to the solar cycle [JINST, 6 (2011) P01003 ; PoS(ICRC2015)074, PoS(ICRC2019)1147].

The Open scaler data are provided as the 15-minutes counting rate averaged over the detectors that pass quality selections, based on the number and status of the PMTs in operation and on the counting rate. As this is altered by the varying atmospheric pressure, i.e., by the varying overlying atmospheric burden, the rate is then corrected by means of a linear fit of the pressure dependency

The "scaler.csv" file contains:
  • time: Unix time in seconds (seconds since 1st Jan 1970, w/o leap seconds)
  • rateCorr: corrected scaler rate [counts/m2/s]
  • arrayFraction: Fraction of array in operation [%]
  • rateUncorr: average detector scaler rate, uncorrected [counts/s]
  • pressure: barometric pressure [hPa]

Atmospheric data

Atmospheric effects on the development of extensive air showers can be understood in terms of local changes in atmospheric parameters. Changes in the atmospheric pressure lead to changes in the rates of the recorded showers. When the pressure rises, there is more material for the cosmic rays to cross and so the detected rate falls. At fixed pressure, if the temperature increases, the particles in the shower will spread out more as the distance travelled between each scattering rises. This effect is described by the Molière radius which is thus a function both of temperature and pressure. This radius has a mean value of ~90 m at the Auger Observatory and defines the spread of the electrons in the showers. Changes in the bulk properties of the atmosphere such as air pressure, temperature, and humidity, have a significant effects on the rate of nitrogen fluorescence emission, as well as on light transmission.

The atmosphere conditions at the Auger site are continuously monitored at five meteorological stations located at the site of Central Laser Facility (CLF), at the center of the array, and at each FD site. The weather stations are equipped with temperature, pressure, humidity, and wind speed sensors recording data every 5 min or 10 min. The statistical uncertainties for these data are 0.2 °C for temperature, 2% for the relative humidity, 0.1 m/s for the wind speed, and 0.2 hPa for the pressure.

The five flows of data acquired at the weather stations are reduced and pre-processed before being used in the procedure of reconstruction of showers. The data from the central CLF weather-station are used, available every 5 minutes for most of the time. When gaps in the data between 10 minutes up to three hours are present, the data are simply interpolated from the values at the endpoints of those empty intervals. For longer periods when a station is not operational, we use data from the other stations, if available, or otherwise discard the period. The raw values of air pressure, temperature, and humidity are combined to determine the air density, a parameter used in the reconstruction of the shower events. To calculate the air density, we consider air, at first order, as a mixture of ideal gases, namely Nitrogen N2 (78.081% in volume), Oxygen O2 (20.941%) and Argon (0.934%) with traces of carbon dioxide (about 400 parts per million). The dependence on the water vapor of the air density is accounted for by using the monitored relative humidity, that measures the partial vapor pressure of water relative to the maximum amount of water that air can dissolve at a certain temperature.

The high-level file contains the processed weather data, needed, in particular, to calculate the corrections of the energy estimator, i.e., of the signal at 1000 m from the core, in the following format:
  • time: Unix time [s]
  • temperature: air temperature [°C]
  • pressure: barometric pressure [hPa]
  • density: air density [kg/m3]
  • avgDensity2HoursBefore: value of air-density measured two hours earlier [kg/m3]

The pseudo-raw files contain data collected by the five weather stations located in different places of the observatory, in the following format:

  • time: Unix time [s]
  • temperature: air temperature [°C]
  • humidity: relative humidity [%]
  • windSpeed: average wind speed [km/h]
  • pressure: barometric Pressure [hPa]

Download CSV high-level and pseudo-raw weather-stations data (65 MB). These files include data of all weather-stations.

Auxiliary files

In addition to data, auxiliary data are available here, namely the list of the positions of the SD detectors and of the FD pixels, as well as the SD exposure and the FD acceptance.

The "sdMap.csv" file contains the position in UTC coordinate system of all stations of the surface detector and time period of activity, in the following format:

  • id : identification number of the station
  • northing,easting,altitude: UTC coordinates [m]
  • start: GPS time of the first event detected by the station
  • stop: GPS time of the last event detected by the station. The value is 1 if the station is still in operation
  • sd1500: the value is 1 if the station is part of the SD1500 array
  • sd750: the value is 1 if the station is part of the SD750 array

The "fdPixelMap.csv" file contains information about the position of a pixel in the FD telescopes and its pointing direction:

  • pixel: identification number of the pixel: [0-2639] for eyes 1-4, [0, 1319] for eye 5, [0-3959] for eye 6
  • eye: identification number of the FD site [1-6]
  • pixelTel: identification number of the pixel in an FD telescope [1-440]
  • tel: identification number of the telescope [1-6]
  • col,row: number of column [1-20] and row [1-22] of the pixel in the telescope
  • backwallAngle: angle of the right wall of the FD site with respect to the East (backwallAngle = 0), growing anticlockwise [deg]
  • elevation,azimuth: pointing direction of the pixel [deg]

The exposure files ("sd1500exposure.csv", "sd1500exposureInclined.csv" and "sd750exposure.csv") contain, for each SD event, the value of the exposure cumulated up to the time of its detection. Above the full efficiency threshold, (2.5 EeV for SD1500 vertical events, 4 EeV for the inclined ones, and 0.1 EeV for SD750 events) the calculation of the exposure is purely geometrical, obtained from the integration of the geometrical aperture over the observation time:

  • gpstime: GPS time
  • sd_exposure: value of the exposure at the corresponding GPS time (taking into account the 10% data released) [km2·sr·yr]
  • sd_exposure_all: full Auger exposure without the 10% rescaling [km2·sr·yr]

The FD-related "fdXmaxAcceptance.csv" and "fdXmaxResolution.csv" files are CSV versions of the Tables Appendix B.II and Appendix B.III as published in [Phys. Rev. D 90, 122005 (2014) (arXiv)] Appendix A. In these tables energy-dependent properties of the acceptance and resolution of FD-reconstructed Xmax are tabulated:

  • The column fields of "fdXmaxAcceptance.csv" are
    • energyBin: index of energy bin
    • lgMinEnergy: start of energy bin [log(E/eV)]
    • lgMaxEnergy: end of energy bin [log(E/eV)]
    • Xacc1: the Xmax value below which acceptance effects become relevant [g/cm2]
    • Xacc1err: statistical error of former [g/cm2]
    • Xacc2: the Xmax value above which acceptance effects become relevant [g/cm2]
    • Xacc2err: statistical error of former [g/cm2]
    • lambda1: exponential slope of acceptance for Xmax < Xacc1 [g/cm2]
    • lambda1err: statistical error of former [g/cm2]
    • lambda2: exponential slope of acceptance for Xmax > Xacc2 [g/cm2]
    • lambda2err: statistical error of former [g/cm2]
  • The column fields of "fdXmaxResolution.csv" are
    • energyBin: index of energy bin
    • lgMinEnergy: start of energy bin [log(E/eV)]
    • lgMaxEnergy: end of energy bin [log(E/eV)]
    • sigma1: width of first Gaussian [g/cm2]
    • sigma1Err: statistical error of former [g/cm2]
    • sigma2: width of second Gaussian [g/cm2]
    • sigma2Err: statistical error of former [g/cm2]
    • f: relative weight between two Gaussians

Download the "sdMap.csv" file.

Download the "fdPixelMap.csv" file.

Download the "fdXmaxAcceptance.csv" file.

Download the "fdXmaxResolution.csv" file.

Download all auxiliary files (400 kB ZIP file).