Outreach

   Contents

Cosmic rays in a nutshell

Cosmic rays are like rain from space, falling continuously on the earth. They are predominantly the nuclei of the common elements, from hydrogen to uranium, with energies ranging from ~1 GeV (109 eV) to beyond 100 EeV.
At their highest energies, cosmic rays have a speed close to that of light and they are over ten million times more energetic than anything humans have ever produced, even with the largest and most powerful particle accelerator built at CERN, the Large Hadron Collider ( LHC ).
Cosmic rays were discovered in 1912, and were used during the 1930s and 1940s to make some of the earliest discoveries of elementary particles, yielding information about the nature of the sub-atomic world before high-energy particle accelerators were invented.  The study of cosmic rays led to the discovery of numerous particles, some of which were predicted by the theory, such as the positron, the first particle of antimatter, and others that were unexpected, such as the kaon and the muon.

Energy units in particle physics

An electron volt (eV) is the amount of kinetic energy gained by a single electron accelerating from rest through an electric potential difference of one volt in vacuum.
1 eV = 1.6 x 10⁻¹⁹ J
1 GeV = 109 eV
1 TeV = 1012 eV
1 PeV = 1015 eV
1 EeV = 1018 eV
The kinetic energy of a mosquito is ~1 TeV

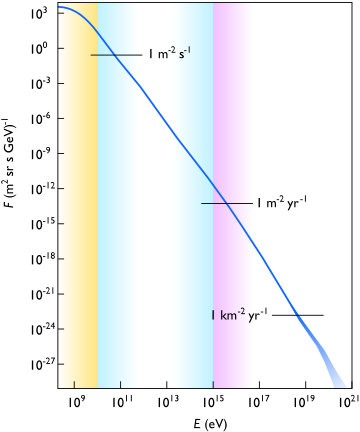
The all particles- spectrum

While at the lowest energies, cosmic rays originate within our solar system, produced from explosive events on the Sun, like flares and coronal mass ejections, at higher energies they come from further away. As their energy increases, the source location in the Universe changes, from within our Galaxy to other galaxies. Some galactic cosmic rays are thought to be generated by shock waves from exploding stars called supernovae. The highest-energy cosmic rays are most probably produced outside of our Galaxy, where phenomenal objects, such as supermassive black holes, or gamma-rays bursts, or starburst galaxies, the most luminous objects in the universe, may be able to accelerate cosmic rays to such energies.
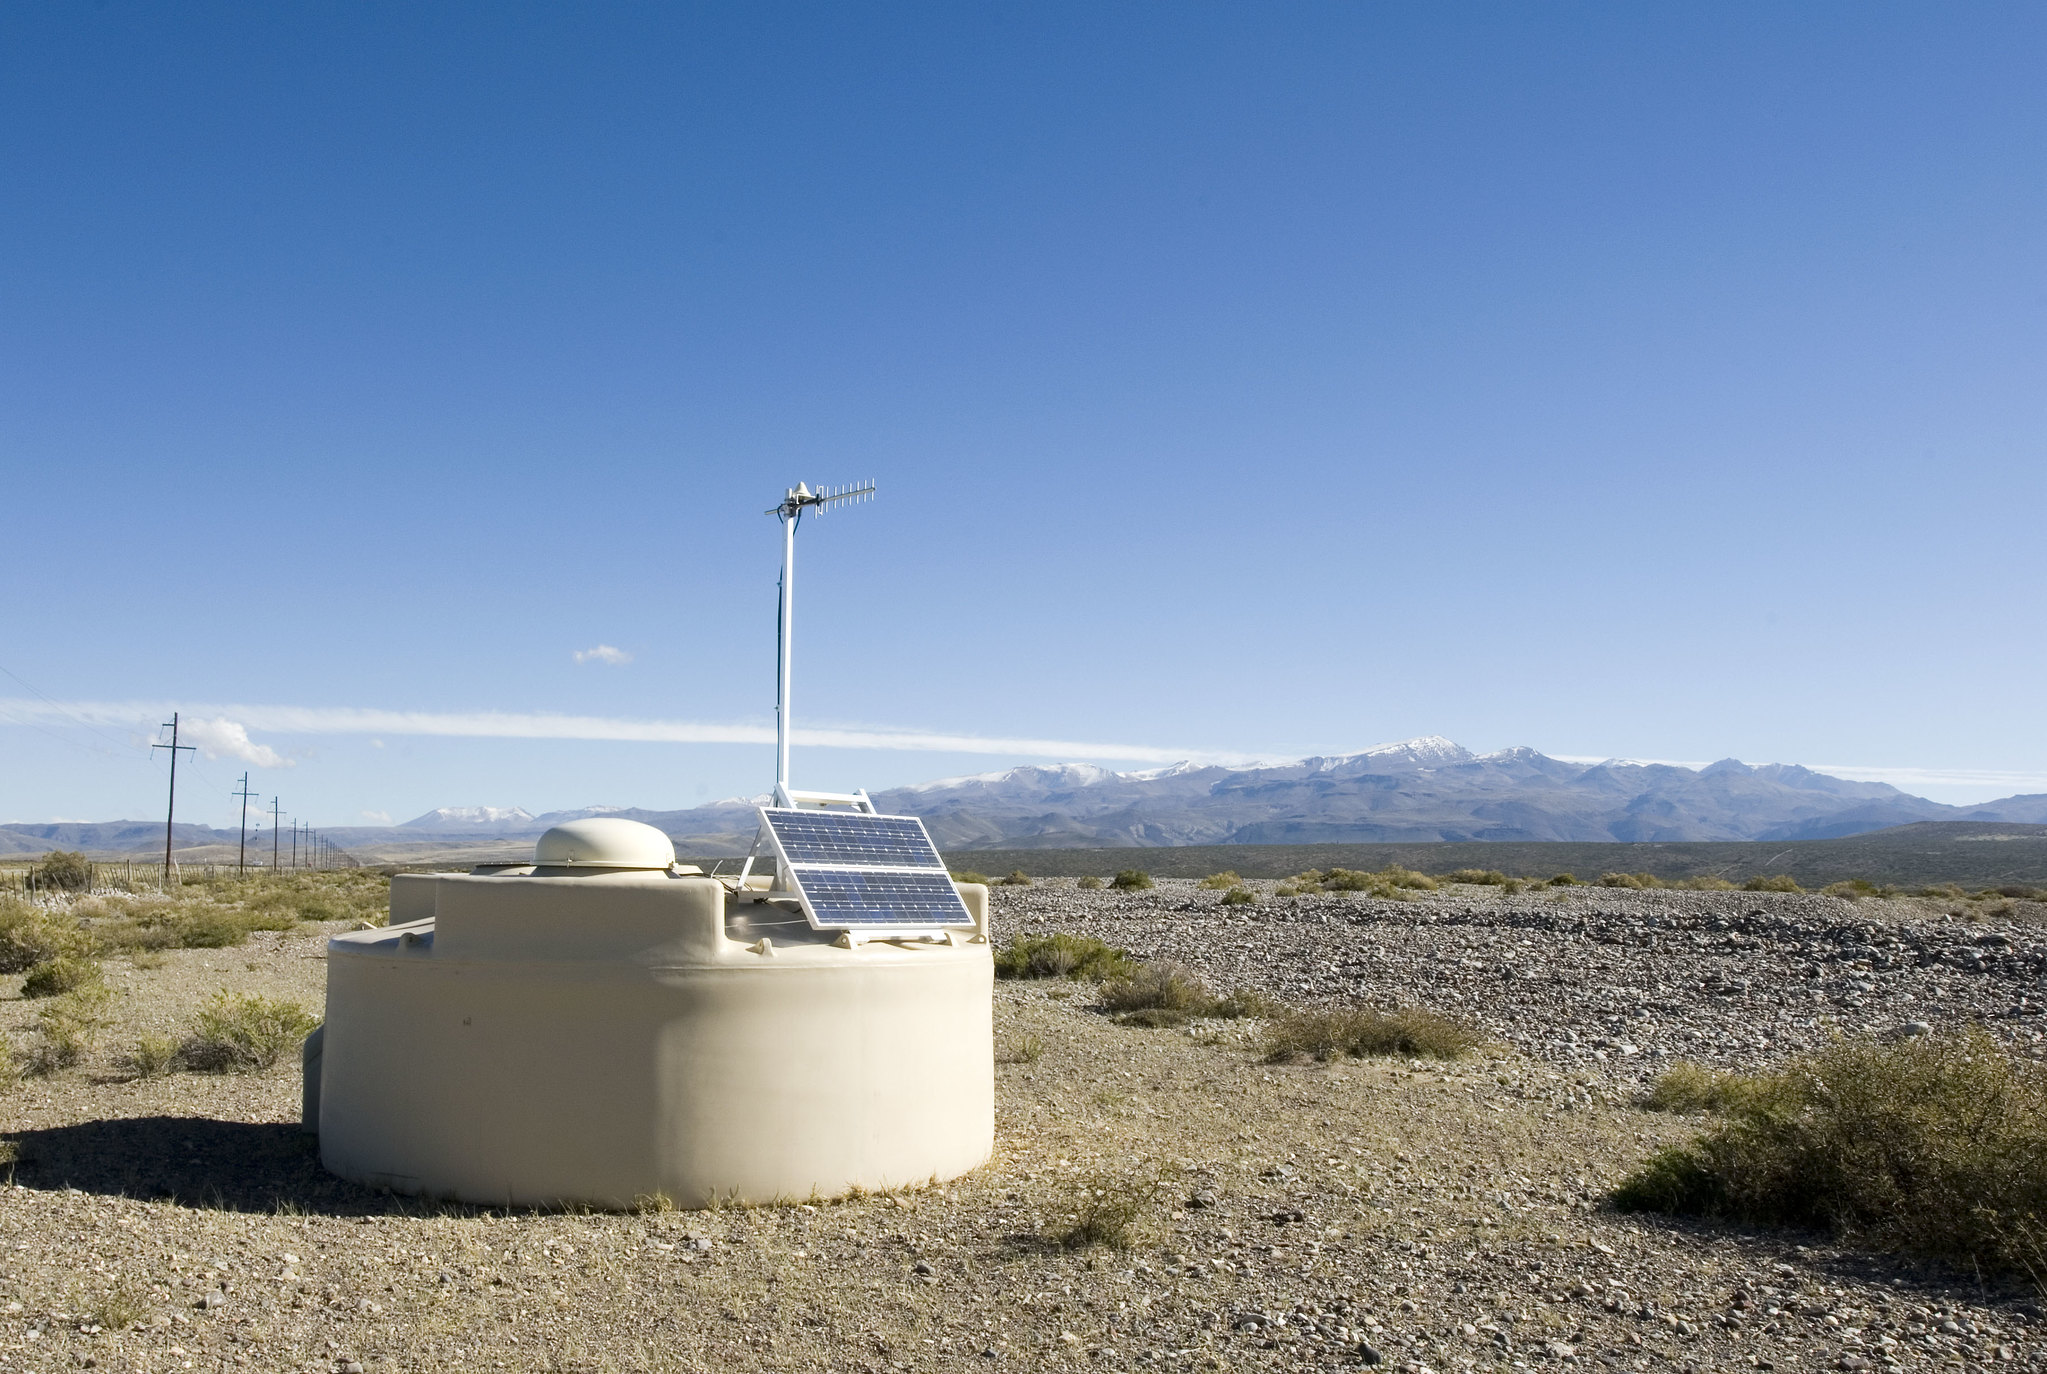
Scientists continue to search for the origin of cosmic rays. They use different kinds of instruments depending on the energy they are investigating. If one draws the flux of cosmic rays (i.e., the flow rate per unit of surface, of solid angle, of time and of energy) as a function of the energy, as illustrated in figure 1 by the blue line, one can clearly see that it drops off dramatically as the energy increases. Cosmic rays of lower energy (yellow and cyan bands) are measured directly by sending detectors to heights above most of the Earth's atmosphere, using high-flying balloons or satellites. For high-energy cosmic rays (magenta band and above), however, given their very low rate, the Earth’s atmosphere is used to detect them. This allows indirect observation of cosmic rays by detection of the shower of particles, called extensive air showers, that they produce in the air.

Particle zoo

A photon is the smallest discrete amount of electromagnetic radiation. It is the basic unit of all light.
An electron, e-, is a negatively charged subatomic particle. It can be either free (not attached to any atom), or bound to the nucleus of an atom.
A positron, e+, is the antimatter counterpart of the electron. It has the same mass as an electron but is positively charged. When a positron collides with an electron, annihilation occurs. If this collision occurs at low energies, it results in the production of two photons.
A muon, μ, is an elementary particle, like an electron, but it is 200 times heavier. It exists in negative and positive forms. Unlike an electron, it is unstable and decays into other particles. At rest, its mean lifetime is ~2 μs.
A pion, π, is a combination of up and down quarks and antiquarks, the most basic forms of matter that make up the heavier particles. Pions may be positive, negative, or neutral, and have a mass about 270 times that of the electron. Charged pions most often decay into muons and muon neutrinos, while neutral pions generally decay into two high energy photons.
At rest the mean lifetime is ~26 ns for charged pions and 8.4 × 10⁻¹⁷ s for neutral pions.

Extensive air showers in a nutshell

An extensive air shower occurs when a fast-moving cosmic ray particle strikes a nucleus, usually of oxygen or nitrogen, high in the atmosphere, creating a violent collision. A variety of particles emerges from these collisions: some are nuclear fragments, while others are less common particles, called mesons, such as pions and kaons. These mesons are not the constituents of the matter with which we normally deal: they are unstable particles that live only briefly. When they decay, more particles are generated, including muons, neutrinos and photons.

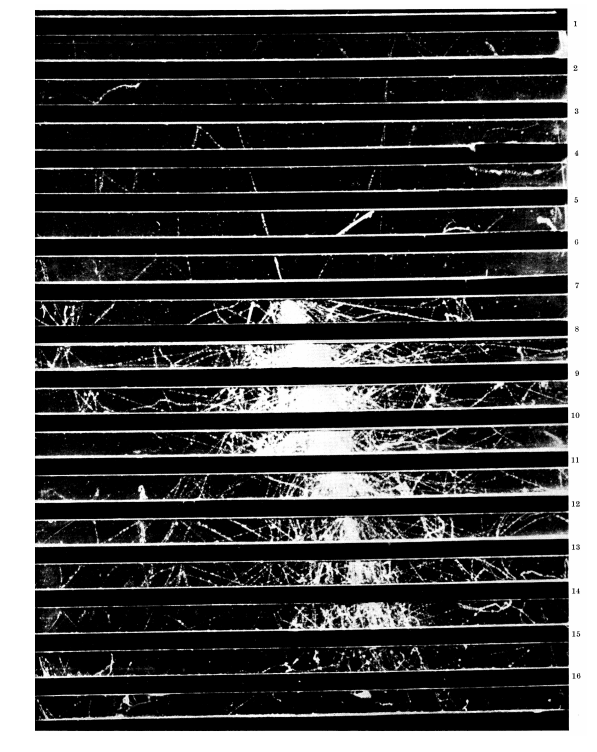
Image of a particle cascade, or shower, as seen in a cloud chamber at 3027 m altitude. The cross-sectional area of the cloud chamber is 0.5 × 0.3 m2 and the lead absorbers have a thickness of 13 mm each [Fretter, 1949].

These photons then produce electrons and anti-electrons (positrons). These in turn again radiate photons, which produce more electrons (and positrons), and so on and so forth. A cascade thus develops as this process is repeated over many generations as the particles travel down through the atmosphere. The number of particles keeps increasing, until the energy of the secondary electrons and positrons is too low for the cascades to continue further. This is when the number of particles in the shower reaches its maximum, after which it starts to attenuate. An example of a cascade is shown in the figure on the side, where the thin white lines are the tracks of particles. Here the incoming track is that of a proton of about 10 GeV that produces a shower of other particles when colliding with lead nuclei in the layers visible as horizontal black bands. The shower starts to fade away after passing the 5th layer after the first collision. The particles are here visualized using an instrument, called a “Wilson cloud chamber”, where evaporated alcohol condenses on ions left in the gas of the chamber by the charged particles. Cosmic-ray cascades are similar, although much richer in particles and much larger in dimension. In the cloud chamber, the lateral extension of the pictured shower is over an area of a few square centimeters, while cosmic showers in air range between tens of meters to tens of kilometers, depending on the energy of the initiating cosmic ray. The spread of the shower is due, on the one hand, to the scattering of the electrons and photons as they travel through the atmosphere and, on the other hand, to the emission of pions and muons at angles away from the direction of travel of the parent that initiates the collision. The atmosphere thus serves to amplify the number of particles and to spread them over a large area so that the shower can be recorded at ground using a few detectors located strategically. The particles in the shower travel in a disc, shaped like a giant dinner-plate, with the particle numbers falling-off steeply as one moves from the central region towards the edges. The disc of particles is a few meters thick in the center and may be hundreds of meters thick well away from the center. The video below shows an artistic view of a shower developing until its particles hit an array of detectors spread over the ground.
Although these detectors catch only a fraction of the shower particles, and at only at one level of the development, researchers are still able to reconstruct the shape and size of the shower, and from these, to trace back the characteristics of the primary cosmic ray, such as direction and energy. Shower particles also radiate on their way down in the atmosphere. A faint light is produced, from either Cherenkov or fluorescence radiation. Air showers can also generate detectable pulses of electromagnetic radiation at radio frequencies, thanks to their interaction with the magnetic field of the Earth.
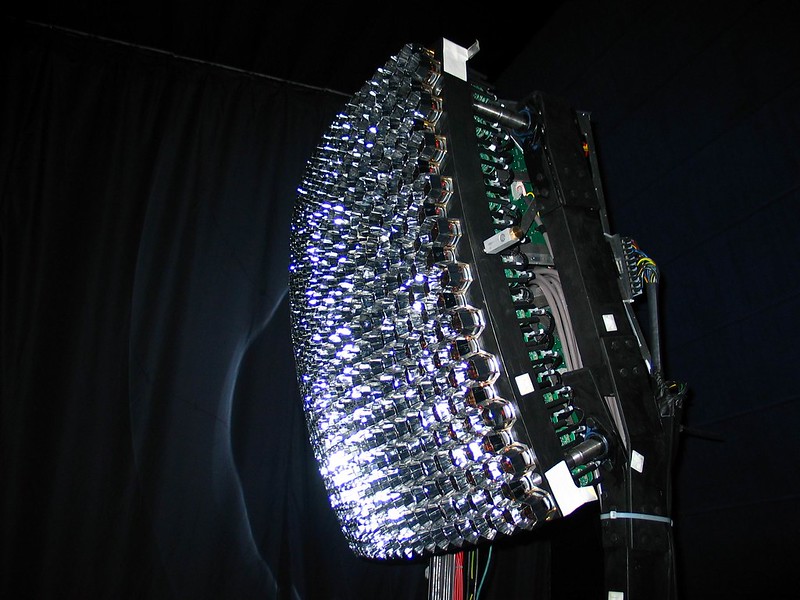
To make the process of shower reconstruction more precise, researchers thus often use arrays of mirrors and photo-sensors to ‘photograph’ the passage of the slightly luminous shower wake, and arrays of radio antennas to ‘listen’ to the radio signals from the cascades, together with arrays of particles detectors

The Pierre Auger Observatory


Located in the vast plain known as the Pampa Amarilla (yellow prairie) in western Argentina, the Pierre Auger Observatory is used to study the highest-energy cosmic rays. Besides being extremely energetic, these particles are also extremely rare.

Cosmic rays with energies above 1020 eV (equivalent to the kinetic energy of a tennis ball traveling at 85 km per hour, but packed into a single nucleus!), have an estimated arrival rate of less than 1 per square meter per hundred million years! To record a large number of these exceptional events, the Auger Observatory covers an area of about 3000 km2, which is the size of the state of Rhode Island (USA), or a bit larger than the country of Luxembourg. This makes it the world’s largest cosmic-ray detector. If you want to compare the area covered by the Observatory with a region that is more familiar to you, try to superimpose it on any place on Earth, using the dedicated version of Google maps as in the example shown above.
The higher the energies of the cosmic rays, the larger the dimensions of the extensive air showers that they create. For example, the footprint at ground of a shower induced by a cosmic ray with an energy of 1019 eV covers an area of about 10 km2, 250 times larger than that of a typical international soccer stadium. Because these showers are so large, it is possible to measure them even with a large spacing between detectors. At the Pierre Auger Observatory, 1660 detectors are set out on a triangular grid with a 1.5 km spacing. A detector is shown in the photograph below, with the Andes in the background.

A detector of the surface array.


Each detector consists of a tank that is completely dark inside and contains 12,000 liters of water. The video below shows an artistic view of what happens when charged particles from a cosmic ray air shower pass through it. Because they are traveling faster than the speed of light in water, they produce Cherenkov light when they pass through it. This light is seen by three photo-sensors that view the water volume from above. The measured light is converted to a digital signal using a dedicated electronic system mounted on the tank, which is powered by solar panels and batteries. When at least three tanks near each others are struck simultaneously by a shower, digital signals containing details of the time at which the shower arrived and signal sizes are transmitted to the data center in the close-by city of Malargüe by means of a radio link.

Pierre Victor Auger

Pierre Victor Auger (14 May 1899 – 25 December 1993) was a French physicist, born in Paris. He worked in the fields of atomic physics, nuclear physics, as well as cosmic ray physics and had important roles in the creation of UNESCO and CERN. He is particularly famous for being one of the discoverers of the Auger effect. In his work with cosmic rays, Auger extended earlier work in Germany, discovering that there were coincidence between Geiger counters even when they were 300 m apart. Coincidences at such a separation led him to conclude that the primary energies of the primary particles (he thought that they had to be electrons) was ~1015 eV.
[Rev. Mod. Phys. 11, 288 –1939].

Some of the showers can cause signals in several tens of tanks at the same time!
One such large event is shown here in a map of the Observatory, where you can see the full arrangement of the ground array, with each dot being a surface detector. The colored dots correspond to detectors that have been hit by the particles of the shower. The holes visible in the array map are locations withoutt detectors due to difficulties in accessing the site or with local landowners. Malargüe city, where the Observatory headquarters is located is also indicated. The 4 squares at the border of the array are four buildings (Los Leones, Coihueco, Loma Amarilla, Los Morados), each hosting 6 telescopes used to observe the fluorescence light produced by the showers during clear dark nights.

Map of the Pierre Auger Observatory and the footprint of an extensive air shower hitting SD stations (see text)

Cherenkov and fluorescence light

The russian physiscist, Pavel Cherenkov, discovered in 1934 that when a charged particle passes through a dielectric medium at a speed greater than the speed of light in that medium, it generates a continuous spectrum of emitted light along its track. An acoustic analogy is the shock wave produced when an object flies faster than the speed of sound. The detectors used in the surface array of the Auger Observatory exploit the Cherenkov effect in water. Some 250 photons/cm are emitted at visible wavelength.
Fluorescence is the emission of light by a substance that has absorbed light or other electromagnetic radiation. The charged particles in an air shower interact with atmospheric nitrogen and oxygen, causing it to emit ultraviolet light. Unlike Cherenkov emission, fluorescence emission is isotropic and it makes shower detection possible at great distances. Detection is challenging however as at 15 km detecting a shower of energy ~3 × 10 18 eV is like trying to see a 5 W bulb moving at the speed of light at this distance.

The camera of a fluorescence telescope.

Detection of cosmic-ray light

The two main instruments of the Pierre Auger Observatory rely on the detection of light produced by the shower particles, the Cherenkov light produced in the water tanks, and atmospheric fluorescence light detected with the telescopes. To observe this light, both instruments use photomultipliers. These are photo-sensors that exploit the photoelectric effect, in which electrons are emitted when light shines on a material. Photomultipliers also respond with great speed and sensitivity to burst of lights such as those produced by the passage of showers. Fast electronics converts the current of electrons created by the photomultipliers into a digital signal, which makes it easier to process and store.
The video below shows an artistic view of what happens when a shower passes in front of one telescope. The light form the shower enters the building through a window, and is reflected by a 13 m2 mirror onto a camera made of 440 photo-sensors. The shower light illuminates several of the photo-sensors, forming an image that lies along a line.
The Observatory includes also a variety of instruments that are used to monitor the state of the atmosphere. Weather stations and cloud cameras are located at each of the four fluorescence buildings. Additionally, lasers are installed close to each building and in the center of the array: they are used to fire beams into the atmosphere that can be seen from the fluorescence detectors, enabling checks of the response of the telescopes.


Although the Pierre Auger Observatory was conceived to detect cosmic rays of the highest energies, measurements of low-energy cosmic rays can also be performed, by counting all of the particles hitting the individual ground detectors. Most of the events detected by single detectors are due to solitary particles, residuals of showers generated by cosmic rays with energy between 1010 eV and 1012 eV. As at such energies the flux of cosmic rays observed at the Earth is modulated by the solar activity. Because of this, the Observatory is also used to study space weather, that is, the phenomena that take place in the space surrounding the Earth, influenced by the variability of the Sun over periods ranging from hours to year.
The Observatory is located at a mean altitude of about 1400 m, between latitudes 35.0°S and 35.3°S and between longitudes 69.0°W and 69.4°W. Data-taking started on 1 January 2004 with 154 ground detectors and one fluorescence detector in operation. Installation was completed in June 2008 and running has been on-going since that date. The Observatory is operated by a Collaboration of more than 400 scientists, engineers, technicians and students from more than 90 institutions in 18 countries. You can find further information about the Observatory and the Collaboration on the Auger website.

Datasets

The Open Data from the Pierre Auger Observatory consist of three different sets. The cosmic-ray data include 25086 showers measured with the surface detector array (SD events) and 3156 hybrid  events, that is, showers that have been recorded simultaneously by the surface and fluorescence detectors (FD). The atmospheric data include the measurements from weather stations of the temperature, pressure, humidity, and wind speed at the Observatory site. The scaler data consist of more than 1015 events recorded via the particle-counter mode, which counts the particles hitting each of the 1600 surface detectors every second. You can enjoy manipulating these data in the 'Explore data' section.

All Open Data from the Observatory have a unique DOI that you are requested to cite in any applications or publications. The DOI of the datasets is 10.5281/zenodo.4487612. The Auger Collaboration does not endorse any work, scientific or otherwise, produced using these data, even if available on, or linked from, this portal.

The cosmic-ray dataset consists of 10% of the events recorded by the Pierre Auger Observatory that pass the same high-level quality criteria that the Auger Collaboration uses for their scientific publications. The available measuremet periods extend from January 2004 to August 2018 for the SD events, and from January 2004 to December 2017 for the hybrid events.

Download the summary file . This file includes the characteristics of the showers detected, such as energy and arrival direction, as obtained by the reconstruction procedure used by the Auger Collaboration. A description of how a shower is reconstructed is given below.

Explore the file content
Variable Description
idevent identification number: YYDDDSSSSSXX
- YY : last 2 digits of year
- DDD : day number between 1 and 366
- SSSSS: second of the current DAY between 0 and 86399
- XX : order of the event at the current second
Time is expressed in UTC+12h., i.e., the day starting at noon
gpstimeGPS time
sdStandard
[0,1]
1: event is used in standard SD analysis
hdSpectrum
[0,1]
1: event used for hybrid energy spectrum analysis
hdCalib
[0,1]
1: event used for hybrid energy calibration analysis
hdXmax
[0,1]
1: event used for hybrid Xmax analysis
multiEye
[0,1]
1: a multi-eye event
sd_gpsnanotime [ns]The GPS time of the event within its GPS second
sd_theta
[deg]
Zenith angle
sd_dtheta
[deg]
Uncertainty in the zenith angle
sd_phi
[deg]
Azimuth angle
sd_dphi
[deg]
Uncertainty in the azimuth angle
sd_energy
[EeV]
Energy
sd_denergy
[EeV]
Uncertainty in the energy
sd_l,sd_b
[deg]
Galactic longitude and latitude
sd_ra,sd_dec
[deg]
Right ascension and declination
sd_x,sd_y,sd_z
[m]
Coordinate of the shower core (site coordinates system)
dx,dy
[m]
Uncertainty in the coordinates of the shower core (site coordinates system)
sd_easting,sd_northing,sd_altitude
[m]
Eastward-,northward-coordinate and altitude of the shower core (UTM coordinates system)
sd_R
[m]
Radius of curvature of the shower
sd_dR
[m]
Uncertainty in the radius of curvature of the shower
sd_s1000
[VEM]
Expected signal at 1000 m from the core, S(1000), used as estimator of the energy
sd_ds1000
[VEM]
Uncertainty in S(1000)
sd_s38
[VEM]
Signal produced at 1000 m by a shower with a zenith angle of 38 deg
sd_gcorr
[%]
Geomagnetic correction to S(1000)
sd_wcorr
[%]
Weather correction to S(1000)
sd_beta,sd_gammaSlope parameters of the fitted LDF
sd_chi2Chi-square value of the LDF fit
sd_ndfNumber of degrees of freedom in the LDF fit
sd_geochi2Chi-square value of the geometric fit
sd_geondfNumber of degrees of freedom in the geometric fit
sd_nbstatNumber of triggered stations used in reconstruction
fd_gpsnanotime [ns]The GPS time of the event within its GPS second
fd_hdSpectrumEye
[0,1]
1: Eye used for the spectrum analysis
fd_hdCalibEye
[0,1]
1: Eye used for energy calibration analysis
fd_hdXmaxEye
[0,1]
1: Eye used for Xmax analysis
fd_theta, phi
[deg]
The zenith and azimuth angles
fd_dtheta, dphi
[deg]
Uncertainties in zenith and azimuth angles
fd_l, fd_b
[deg]
Galactic longitude and latitude of the event
fd_ra, fd_dec
[deg]
Right ascension and declination of the event
fd_totalEnergy
[EeV]
Total energy of the primary particle initiating the event
fd_dtotalEnergy
[EeV]
Uncertainty in the total energy of the event
fd_calEnergy
[EeV]
Calorimetric energy of the event
fd_dcalEnergy
[EeV]
Uncertainty in the calorimetric energy of the event
fd_xmax
[g/cm2]
Position of the maximum of the energy deposition in the atmosphere
fd_dxmax
[g/cm2]
Uncertainty in the position of the maximum of the shower development in the atmosphere
fd_heightXmax
[m a.s.l.]
Height of Xmax above the ground
fd_distXmax
[m]
Distance of Xmax to FD eye
fd_dEdXmax
[PeV/(g/cm2)]
Maximum energy deposit
fd_ddEdXmax
[PeV/(g/cm2)]
Uncertainty in the maximum energy deposit
fd_x, fd_y, fd_z
[m]
Coordinates of the shower core projected at ground level (site coordinates system)
fd_dx, fd_dy, fd_dz
[m]
Uncertainty in the coordinates of the shower core projected at ground level (site coordinates system)
fd_easting, fd_northing
[m]
Eastward and Northward coordinate of the shower core projected at ground level (UTM coordinates system)
fd_altitude
[m]
Altitude of the shower core projected at ground level (UTM coordinates system)
fd_cherenkovFractionFraction of detected light from Cherenkov emission
fd_minViewAngle
[deg]
Light emission angle from the shower towards the FD eye
fd_uspL
[g/cm2]
Universal shower profile shape parameter L
fd_uspRUniversal shower profile shape parameter R
fd_duspL
[g/cm2]
Uncertainty in the Universal Shower Profile parameter L
fd_duspRUncertainty in the Universal Shower Profile parameter R
fd_hottestStationIdid of the SD station with the highest recorded signal
fd_distSdpStation
[m]
Distance of the hottest station to the plane that includes the shower axis and the eye position (SDP)
fd_distAxisStation
[m]
Distance of hottest station to the reconstructed shower axis in the shower plane

How to find the properties of high energy cosmic rays from extensive air showers
All shower particles travel at speeds very close to that of the light, that is about 300 000 000 meters per second. Thus, in practice, they travel all 'packed' together so that a shower can, in fact, be thought of as a thin, radially extended, and slightly curved, disk of particles propagating longitudinally at the velocity of light along the initial direction of the primary cosmic-ray. The particle density is largest at the center (or core) of the disk, and decreases as one moves towards the edges of it. The disk reaches the water-Cherenkov detectors and the particles pass through them in an order, and at relative times, that depend on the arrival direction of the primary cosmic ray. The passage of the shower across the detectors of the Observatory is illustrated in the map below.

Figure 1: Footprint of a shower that hit 30 surface detectors.

The colored dots correspond to the 30 stations in this event that were hit by the shower particles, with the colors representing the time of their arrival (green: early hit; red: late hit). If the shower is vertical, for example, the particles of the shower hit the detectors at the nearly same time. By contrast, if the arrival direction is more inclined, the disk sweeps progressively across the detectors at the speed of the light. If you think of a shower arriving from the largest possible inclination, that is from a direction of 90 degrees from the vertical, it takes only 5 millionth of seconds (5 microseconds, μs) to travel the 1500 m between two adjacent tanks. Thus the detector electronics must be extremely fast to record the shower passage. The electronics that we use is capable of recording the timing of the light signals with a precision of 25 billionth of seconds (that is, 25 nanoseconds, ns), so that, from triangulation of the signal times recorded at each tank, we are able to determine the arrival direction, perpendicular to the disk, with a precision of about 1°. For example, the shower shown in figure 1 arrived at 54.1° from the vertical, along a direction, indicated by the arrow, pointing at 53.8° from the east.
You can find many digitized light-signals in the data-visualization page.

Figure 2: Digitized light-signals in two different stations hit by a shower. The different colors correspond to the signals from the 3 photomultipliers. The signal unit (VEM) is a proxy of the energy released in the detectors by the passing particles.

Two examples are shown in the two panels in the adjacent figure (figure 2): the station in the top panel is much closer to the core of the shower (about 500 m away) than that in the bottom panel (more than 2500 m away). The higher particle density close to the disk core, and its larger compactness, is reflected in the signal shape, much larger and much more concentrated in the top panel than in the bottom one. The fall-off of the signal size, and hence of the particle density, as a function of the distance is clear in figure 3 below, where the signal sizes recorded in all detectors hit by the shower shown in figure 1 are shown as blue points. The total number of particles in the shower reflects the energy of the primary cosmic ray that has initiated it. It is however impossible, with a distributed array of detectors such as those at the Auger Observatory, to measureo this quantity as the detectors are just too far apart (for practical reasons such as cost).

Figure 3: Fall-off of the signals size as a function of the distance to the shower core (blue dots). The yellow line is an interpolation of the measured signals.


Luckily, scientists have found that the signal size at a certain distance from the shower core is also a good proxy of the energy of the primary cosmic ray. This optimal distance depends only on the spacing among the detectors: for the surface array of the Auger Observatory, this distance is 1000 m. To find the signal at 1000 m, named S(1000), we interpolate the distribution of the signals sizes with a formula that represents the fall of the signal size with distance (yellow line in figure 3) and we derive the value at 1000 m.
Camera view for Los Leones
Camera view for Coihueco

Figure 4: Traces of a cosmic-ray shower in two telescopes of the fluorescence detector.

To convert S(1000) to energy, we use the measurements of the fluorescence telescopes, with which, during clear, moonless nights, we can observe the showers at the same time as with the surface detectors. The shower particles produce fluorescence light all their way through the atmosphere, so that a 'shower-photograph', taken with the telescope cameras, consists of a light signal starting in one of the photomultipliers looking up in the sky, progressing down through a series of other photomultipliers. Two of these photographs are shown in the adjacent figure : they were recorded at the same time by two telescopes during the passage of a shower. The colors show the time at which the light reaches each photomultiplier (green: early hit; red: late hit).

Figure 5: Development curves of a shower observed with two telescopes (green and blue dots). The shower is developing from left (high atmosphere) to right (low atmosphere).


From the amount of light collected at each photomultiplier, we can determine how much energy the shower releases in atmosphere as it passes deeper and deeper in it. This is shown in figure 5 where the green and blue dots indicate the energy released to the atmosphere by the shower, as measured by the two telescopes at Los Leones (LL) and Cohiuecho (CO) respectively. These detectors are about 30 km from the centre of the shower. The two curves show the longitudinal profile of the shower, which starts developing high in atmosphere (on the left), reaches a maximum (in the middle) and then gradually dies away (on the right). As the telescopes allow us to observe the entire shower development, we can thus determine the total energy deposited in the atmosphere, and hence the energy of the primary cosmic ray, rather straightforwardly. The measurement of the shower profile is also very useful for inferring the mass of the primary cosmic ray, as the depth of the shower maximum in atmosphere, so called Xmax, depends upon it. 'Smaller' nuclei, such as those of hydrogen atoms that contain only one proton, are capable to penetrate deeper in atmosphere before starting a shower than 'bigger' nuclei that are composed of a larger number of protons.


Atmospheric data

Atmospheric effects on the development of extensive air showers can be understood in terms of local changes in atmospheric parameters. Changes in the atmospheric pressure lead to changes in the rates of the recorded showers. When the pressure rises, there is more material for the cosmic rays to cross and so the detected rate falls. At fixed pressure, if the temperature increases, the particles in the shower will spread out more as the distance travelled between each scattering rises. This effect is described by the Molière radius which is thus a function both of temperature and pressure. This radius has a mean value of ~90 m at the Auger Observatory and defines the spread of the electrons in the showers. Changes in the bulk properties of the atmosphere such as air pressure, temperature, and humidity, have a significant effects on the rate of nitrogen fluorescence emission, as well as on light transmission.

The atmosphere conditions at the Auger site are continuously monitored at five meteorological stations located at the site of Central Laser Facility (CLF), at the center of the array, and at each FD site. The weather stations are equipped with temperature, pressure, humidity, and wind speed sensors recording data every 5 min or 10 min.

The 'weather.csv' file contains the processed weather data, needed, in particular, to calculate the corrections of the energy estimator, and contains also the value of air-density.

Download weather-stations data

Explore the files content

Files: wsCLF.csv, wsLL.csv, wsLM.csv, wsLA.csv, wsCO.csv

Variable Description
timeUnix time [s] (seconds since 1st Jan 1970)
temperatureair temperature [°C]
humidityrelative humidity [%]
windSpeedaverage wind speed [km/h]
pressurebarometric Pressure [hPa]
densityair density [kg/m3]

File: weather.csv

Variable Description
timeUnix time [s] (seconds since 1st Jan 1970)
temperatureair temperature [°C]
pressurebarometric Pressure [hPa]
densityair density [kg/m3]
avgDensity2HoursBeforevalue of air-density measured two hours earlier [kg/m3]

Scaler data

The Auger Scaler Open Data consist of more than 1015 events detected from March 2005 to December 2020. They have been recorded via the so-called 'scaler mode', or 'particle-counter' mode, which counts the particles hitting each of the 1600 water-Cherenkov detectors during a time interval of 1 second. The scaler mode was installed in all Auger surface detectors starting from March 2005, and then improved in September 2005. The typical rate per detector is of about 2000 per second (2 kHz) (it was 3.8 kHz before September 2005). The events counted by individual detectors are mostly due to particles associated with showers generated by low-energy cosmic rays (energies from 10 GeV to a few TeV) that die out before the bulk of the particles reaches the ground. The scaler mode consequently does not allow one to reconstruct the energy and the direction of the shower, but it allows the study the temporal behavior of the number of counts, which is modulated by terrestrial and extraterrestrial phenomena. These scaler data can for example be used to observe solar flares, or the 11-year solar cycle [JINST, 6 (2011) P01003 ; PoS(ICRC2015)074, PoS(ICRC2019)1147].

The Open scaler data are provided as the 15-minutes counting rate averaged over the active detectors. As the rate is altered by the varying atmospheric pressure, the rate is corrected for it.

Download scaler data

Explore the file content
Variable Description
timeUnix time [s] (seconds since 1st Jan 1970)
rateCorrcorrected scaler rate [counts/m2/s]
arrayFractionfraction of array in operation [%]
rateUncorraverage detector scaler rate, uncorrected [counts/s]
pressurebarometric pressure [hPa]

   Explore data

In this section you can find some Python notebooks that explore our datasets.
The simplest way to start working with Python is to install Anaconda, a distribution of the Python programming languages for scientific computing (data science, machine learning applications, large-scale data processing, predictive analytics, etc.) that aims to simplify package management and deployment. The distribution includes data-science packages suitable for Windows, Linux, and macOS. Detailed instrunctions to install Anaconda can be found in the official page .
List of modules used in the following notebooks

If some python libraries are not available in your anaconda environment, copy and paste the following line in an Anaconda terminal to install them :

pip install pandas matplotlib numpy pytz scipy datetime

  • pandas : data analysis and manipulation tool.
  • matplotlib : library for creating static, animated, and interactive visualizations.
  • numpy : library for large, multi-dimensional arrays and matrices, with a large collection of high-level mathematical functions to operate on arrays.
  • ipywidgets : interactive HTML widgets for Jupyter notebooks and the IPython kernel.
  • IPython : command shell for interactive computing in multiple programming languages.
  • pytz : library that allows accurate and cross platform timezone calculations.
  • scipy : software for mathematics, science, and engineering. It includes modules for statistics, optimization, integration, linear algebra, Fourier transforms, signal and image processing, ODE solvers, and more.
  • os : module that provides functions for interacting with the operating system.
  • zipfile : class to work directly with a ZIP archive. It supports methods for reading data about existing archives as well as modifying the archives by adding additional files.
  • collections : module provides a rich set of specialized container data types carefully designed to approach specific programming problems in a Pythonic and efficient way.
  • datetime : module taht supplies classes for manipulating dates and times.
  • locale : module that opens access to the POSIX locale database and functionality.
  • random : module that implements pseudo-random number generators for various distributions.

Tutorial: reading CSV files and producing basic histograms

This notebook is a collection of examples that allows the user to explore the content of the summary file and to apply some basic analysis methods.

In particular, the examples explain how to:

  • produce simple histograms,
  • plot the trend of a variable as a function of time or energy,
  • produce maps of cosmic rays landing points and arrival directions,
  • correlate the values of two variables.

  Run it in your browser..

Explore the Surface Detector data

Data collected with the Surface Detector can be used to calculate the number of cosmic-rays hiting our atmosphere. In this notebook we derive the cosmic-rays flux at energies above 2.5·1018 eV, and we address the following questions:
  • How do such energies relate to everyday experience?
  • How rare are cosmic rays at these energies?
  • What is the energy flux carried by cosmic rays at the Pierre Auger site?

  Run it in your browser..

Explore the Hybrid data

Data collected with the surface and the fluorescence detectors simultaneously, the so-called hybrid events, can be used to extract information related to primary cosmic-ray composition. The result is shown on a sky-map in Galactic coordinates.

  Run it in your browser..

Explore the scaler data

Data acquired via the so-called 'scaler mode' can be used for wheather-space science. In this notebook we show how the scaler rate depends on weather condictions, such as pressure, temperature and wind speed.

  Run it in your browser..

Explore the weather stations data

This notebook explains how to handle the weather-stations data to study the atmospheric conditions at the Pierre Auger Observatory and how to exploit these data to calculate the value of air-density in different zones of the Observatory.

  Run it in your browser..

Explore the shower development

The simplest way to describe a shower-particles is the so-called Heitler toy-model. This model is explained in the notebook together with some interactive example of shower-development.

  Run it in your browser..